

AT A GLANCE
- Using the University of Colorado AMD Registry, we evaluated 121 eyes of 66 patients with geographic atrophy (GA) without concurrent choroidal neovascularization to determine which demographic data and imaging biomarkers are associated with a faster GA growth rate.
- Nonexudative subretinal fluid, subretinal hyperreflective material or acquired vitelliform lesions, and incomplete retinal pigment epithelium and outer retina atrophy were positively associated with higher GA growth rates.
- These biomarkers, along with a thin choroid, can easily be identified on OCT and should alert providers to an increased risk of faster disease progression, especially in the setting of larger and multifocal GA lesions, older age, and female sex.
With two FDA-approved complement inhibitors—pegcetacoplan (Syfovre, Apellis) and avacincaptad pegol (Izervay, Astellas)—on the market to slow the progression of geographic atrophy (GA) secondary to AMD, the question is, which patients do we treat? Understanding which patients with dry AMD are at the highest risk for the fastest progression is especially important for effective long-term patient management.
Many studies have explored multimodal imaging biomarkers, and OCT in particular, to predict progression of intermediate AMD to GA, but few have investigated biomarkers that help predict faster GA progression.1,2
Existing studies on GA growth rate have focused on baseline GA characteristics, AI and computational models, and quantitative imaging biomarkers.3-12 While these measures can be effective, they are also time-consuming, expensive, or unavailable in most retina practices. To better care for our patients, we need readily accessible imaging biomarkers to help clinicians determine which patients with GA will rapidly progress and may be good candidates for treatment. In this article, we share our study findings that reveal demographic data and imaging biomarkers that are associated with a faster GA growth rate.13
REGISTRY DATA
The University of Colorado AMD Registry has been enrolling patients longitudinally since 2014 to dynamically evaluate the interplay between changes in multimodal imaging biomarkers, dysregulation of systemic inflammation, and genetics in patients with AMD. Using this registry, we evaluated 121 eyes of 66 patients with GA without concurrent choroidal neovascularization to determine which demographic data and imaging biomarkers are associated with a faster GA growth rate. We evaluated simple and mainly qualitative imaging biomarkers that can assist in accurate and concise clinical decision making.13
We reviewed spectral-domain OCT, color fundus photographs, and fundus autofluorescence images for a variety of imaging biomarkers and baseline GA lesion characteristics. We then calculated the square-root transformed GA growth rate, a commonly accepted measure that helps neutralize the effects of initial GA lesion size. We evaluated associations between square-root transformed GA growth rate and imaging biomarkers, baseline lesion characteristics, and patient demographics using linear regression models.13
KEY FINDINGS
Older age and female sex were associated with increased rates of GA progression. A patient's body mass index was weakly negatively associated with GA growth rate. Smoking history was not associated with GA growth rate.13
Larger areas of GA were associated with increased rates of progression. Multifocal and extrafoveal GA lesions had faster, but not statistically significant, growth rates. These findings support the hypotheses of faster centrifugal growth and the importance of the GA perimeter.13
Nonexudative subretinal fluid (SRF), subretinal hyperreflective material (SHRM) or acquired vitelliform lesions (AVLs), and incomplete retinal pigment epithelium (RPE) and outer retina atrophy (iRORA) were positively associated with higher GA growth rates. While iRORA is a known precursor for GA, less is known about nonexudative SRF and SHRM/AVLs in dry AMD. We believe these biomarkers also precede new GA lesions, increasing the overall GA perimeter area and the rate of GA growth.13
One study in the literature investigated nonexudative SRF in GA and observed a high percentage of progression to GA in areas of SRF overlying drusen and drusenoid pigment epithelial detachments.14 Our findings corroborate that these areas of nonexudative SRF likely represent a degenerative space beneath the retina, rather than an exudative fluid process, and are risk factors for progression to GA (Figure 1).13 SHRM/AVLs in the setting of dry AMD have more recently been hypothesized to represent an accumulation of various breakdown materials due to significant RPE stress and dysfunction or to act as a physical barrier for nutrient exchange, accelerating photoreceptor degeneration and GA progression (Figure 2).15,16
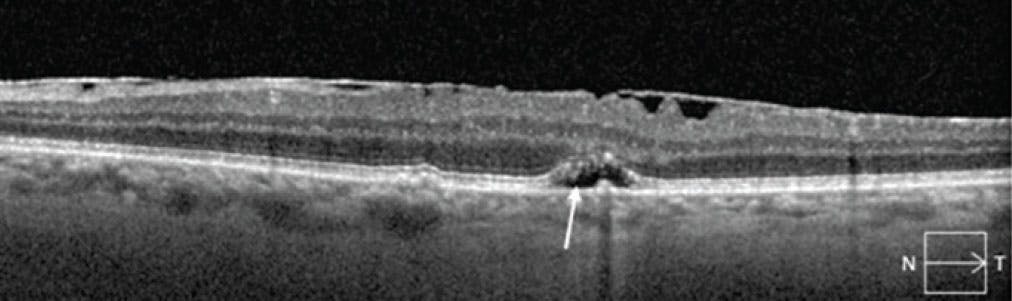
Figure 1. The arrow points to nonexudative SRF with overlying ellipsoid zone attenuation that later progressed to GA.
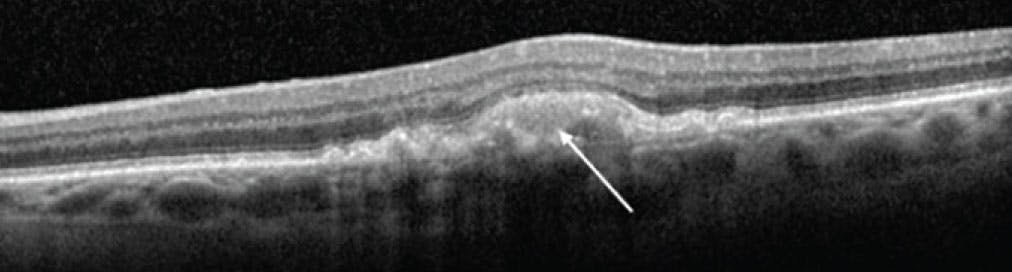
Figure 2. The arrow points to a hyperreflective area representative of SHRM/AVLs that later progressed to GA.
Our study’s third and most intuitive biomarker was iRORA. Once this pattern of damage starts, our study demonstrated that progression to complete RPE and outer retina atrophy (cRORA) is accelerated.13
Retinal pseudocysts and subfoveal choroidal thickness were significantly negatively associated with higher GA progression (Figure 3); this significance held true even after adjusting for age, which has long been associated with choroidal thinning and AMD. Retinal pseudocysts are degenerative, nonexudative retinal cysts that have been hypothesized to correspond to Müller cell degeneration and are commonly found in the inner nuclear layer overlying preexisting GA. There is little research on why these lesions would be associated with a lower GA growth rate, but we hypothesize that they may represent a burning out of the disease process or are protective in some way.13
Interestingly, imaging biomarkers traditionally associated with the development of GA were not associated with increased rates of GA progression in our study. Reticular pseudodrusen, outer retinal tubulation, drusenoid pigment epithelial detachments, and calcified drusen may only be associated with initial GA formation and not play a large role in progression. Investigation with larger sample sizes would be helpful to better evaluate these relationships.13

Figure 3. This OCT image (A) shows multiple retinal pseudocysts (arrow) in the internal nuclear layer overlying an area of cRORA as evidenced by signal hypertransmission (*), an area of cRORA of at least 250 µm (black bracket), and an area of iRORA (white bracket). The red brackets on another OCT image denote the boundaries of a thin choroid (B).
DISCUSSION
When counseling and selecting GA patients for therapeutic intervention, there are many considerations to keep in mind. While a faster GA growth rate is only one piece of the overall picture, it can help guide referrals and discussions. SHRM/AVLs, nonexudative SRF, iRORA, and a thin choroid are biomarkers that can be easily identified on OCT and should alert providers to an increased risk of faster disease progression, especially in the setting of larger and multifocal GA lesions, older age, and female sex.
Further studies investigating choroidal thickness, nonexudative SRF, SHRM/AVLs, and iRORA can help establish reliable indicators of disease progression risk and analyze the efficacy of future GA therapies.
1. Jaffe GJ, Chakravarthy U, Freund KB, et al. Imaging features associated with progression to geographic atrophy in age-related macular degeneration: classification of atrophy meeting report 5. Ophthalmol Retina. 2021;5(9):855-867.
2. Zweifel SA, Imamura Y, Spaide TC, Fujiwara T, Spaide RF. Prevalence and significance of subretinal drusenoid deposits (reticular pseudodrusen) in age-related macular degeneration. Ophthalmology. 2010;117(9):1775-1781.
3. Shen LL, Sun M, Ahluwalia A, Young BK, Park MM, Del Priore LV. Geographic atrophy growth is strongly related to lesion perimeter: unifying effects of lesion area, number, and circularity on growth. Ophthalmol Retina. 2021;5(9):868-878.
4. Sunness JS, Margalit E, Srikumaran D, et al. The long-term natural history of geographic atrophy from age-related macular degeneration: enlargement of atrophy and implications for interventional clinical trials. Ophthalmology. 2007;114(2):271-277.
5. Anegondi N, Gao SS, Steffen V, et al. Deep learning to predict geographic atrophy area and growth rate from multimodal imaging. Ophthalmol Retina. 2023;7(3):243-252.
6. Niu S, de Sisternes L, Chen Q, Rubin DL, Leng T. Fully automated prediction of geographic atrophy growth using quantitative spectral-domain optical coherence tomography biomarkers. Ophthalmology. 2016;123(8):1737-1750.
7. Moult EM, Hwang Y, Shi Y, et al. Growth modeling for quantitative, spatially resolved geographic atrophy lesion kinetics. Transl Vis Sci Technol. 2021;10(7):26.
8. Yu Y, Moult EM, Chen S, et al. Developing a potential retinal OCT biomarker for local growth of geographic atrophy. Biomed Opt Express. 2020;11(9):5181-5196.
9. Moult EM, Shi Y, Zhang Q, et al. Analysis of correlations between local geographic atrophy growth rates and local OCT angiography-measured choriocapillaris flow deficits. Biomed Opt Express. 2021;12(7):4573-4595.
10. Zhang Q, Shi Y, Shen M, et al. Does the outer retinal thickness around geographic atrophy represent another clinical biomarker for predicting growth? Am J Ophthalmol. 2022;244:79-87.
11. Liu J, Shen M, Laiginhas R, et al. Onset and progression of persistent choroidal hypertransmission defects in intermediate age-related macular degeneration: a novel clinical trial endpoint. Am J Ophthalmol. 2023;254:11-22.
12. Chu Z, Shi Y, Zhou X, et al. Optical coherence tomography measurements of the retinal pigment epithelium to bruch membrane thickness around geographic atrophy correlate with growth. Am J Ophthalmol. 2022;236:249-260.
13. de Carlo Forest TE, Gill Z, Lisker-Cervantes A, et al. Association between quantitative and qualitative imaging biomarkers and geographic atrophy growth rate. Am J Ophthalmol. 2024;264:168-177.
14. Hilely A, Au A, Freund KB, et al. Non-neovascular age-related macular degeneration with subretinal fluid. Br J Ophthalmol. 2021;105(10):1415-1420.
15. Zweifel SA, Spaide RF, Yannuzzi LA. Acquired vitelliform detachment in patients with subretinal drusenoid deposits (reticular pseudodrusen). Retina. 2011;31(2):229-234.
16. Willoughby AS, Ying GS, Toth CA, et al. Subretinal hyperreflective material in the comparison of age-related macular degeneration treatments trials. Ophthalmology. 2015;122(9):1846-1853.


-1_1748961738.jpg?auto=compress,format&w=70)


_1784132761.jpg?auto=compress,format&w=75)


