
KEY TAKEAWAYS
- With fundus autofluorescence (FAF), areas of increased or decreased autofluorescence reflect local changes in fluorophore levels, cell health, and overlying tissue, making it a valuable tool for monitoring disease activity and progression.
- FAF imaging is useful for the diagnosis and monitoring of many retinal diseases, including AMD, inherited retinal diseases, tumors, and inflammatory retinal conditions.
- Advances in FAF imaging include spectral analysis and fluorescence lifetime analysis.
Fundus autofluorescence (FAF) is a noninvasive imaging technique that visualizes the naturally occurring fluorescence of structures in the outer retina and beyond. Autofluorescence occurs when endogenous fluorophores are excited by light of a suitable wavelength and then re-emitted with lower energy.1 This article offers a brief guideline for understanding how FAF works and its use in diagnosing and managing various retinal diseases.
HOW IT WORKS
The main anatomical sources of autofluorescence are the photoreceptors and the retinal pigment epithelium (RPE). In particular, the RPE is the main contributor to short-wavelength FAF through lipofuscin and melanolipofuscin organelles, and to near-infrared (NIR) FAF through melanin-containing organelles, such as melanosomes.
Under normal physiological conditions, bisretinoids are formed as byproducts of the visual cycle and gradually accumulate, together with lipids, within RPE lysosomes, forming lipofuscin and melanolipofuscin granules. These granules represent the dominant source of the FAF signal. The number, size, and spatial distribution of these granules within the RPE cells largely determine the FAF pattern observed with short-wavelength excitation (Figure 1).
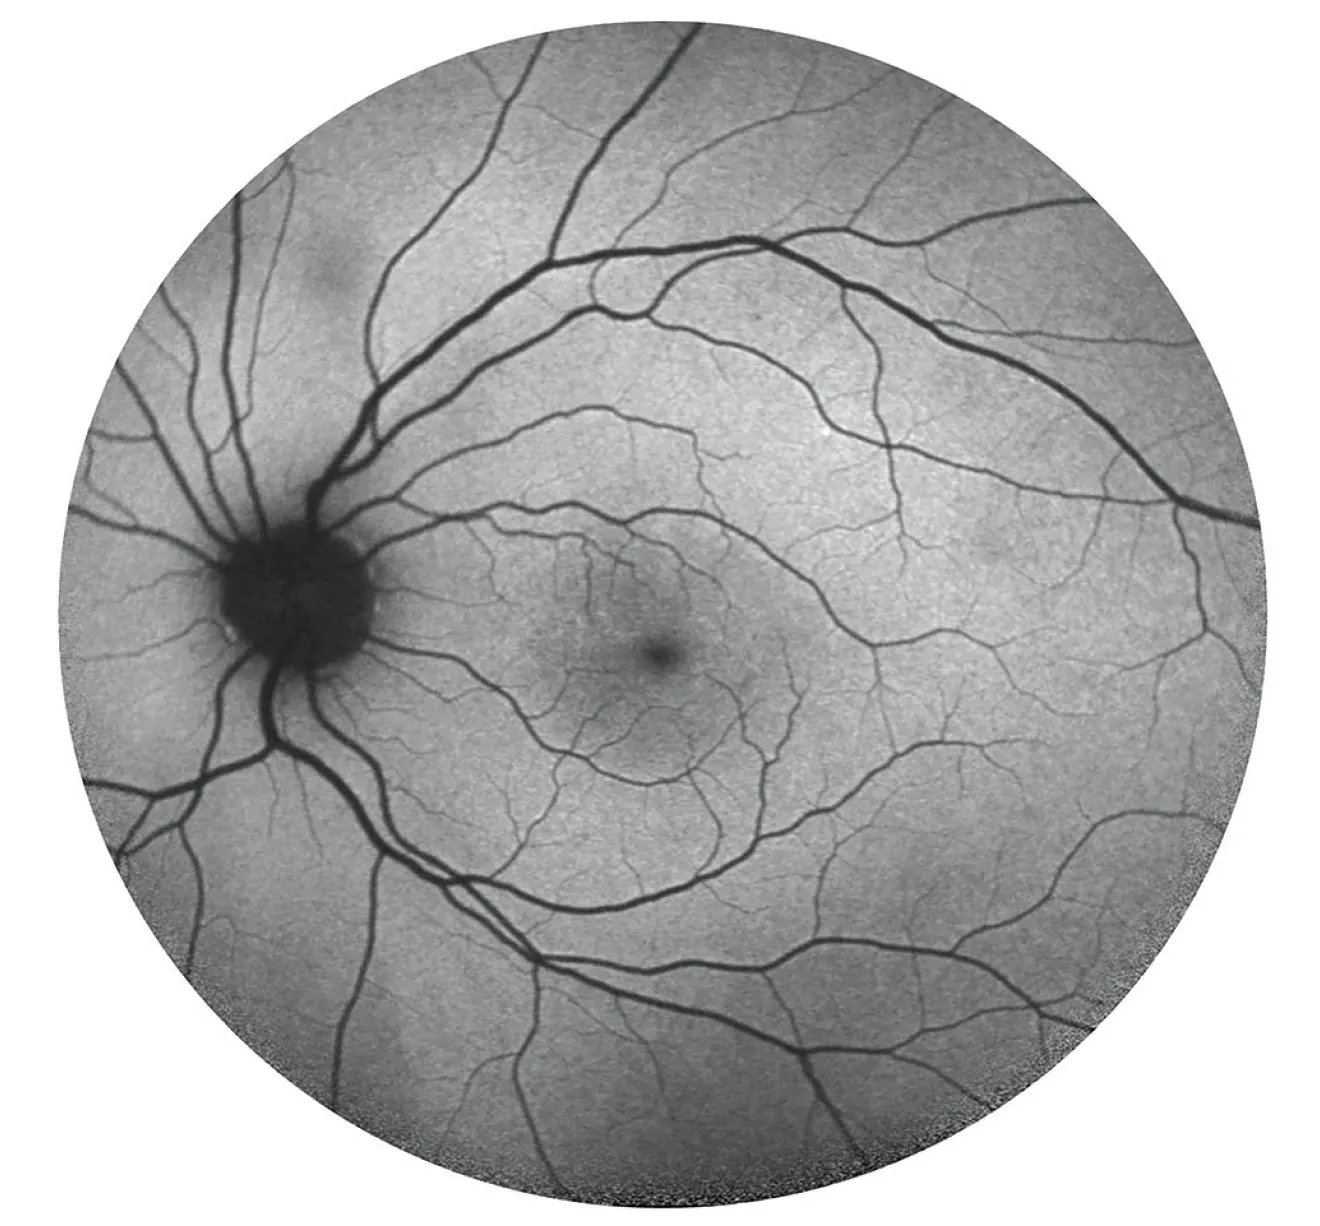
Figure 1. In this this short-wavelength FAF of a healthy eye, the optic disc and retinal vessels are mostly hypoautofluorescent. At the fovea and perifovea, there is hypoautofluorescence due to the macular pigment absorbing blue light. The highest intensity of FAF is normally in the superotemporal edge of the macula.
Granule density increases with age, leading to a progressive rise in FAF intensity, particularly in the perifoveal region and adjacent retinal periphery, often with the highest intensity in the temporal to superotemporal retina.2 This age-related increase has been confirmed by quantitative measurements using spectrophotometry and confocal scanning laser ophthalmoscopy.3 In advanced age, FAF intensity tends to decline, corresponding histologically to a reduction in autofluorescent granules and degenerative RPE changes.
FAF commonly uses short-wavelength excitation around 488 nm with detection above approximately 510 nm, although alternative excitation wavelengths are available. Quantitative FAF (QAF) enables standardized measurement of autofluorescence intensity, allowing comparisons across retinal regions, patients, and longitudinally. Additional techniques, such as fluorescence lifetime imaging ophthalmoscopy and spectral analysis, provide complementary information on the temporal and spectral properties of the signal. Longer-wavelength excitation (green and red/NIR) reduces the influence of the lens and macular pigment.
FAF IN THE OFFICE
In clinical practice, FAF findings are commonly described using three terms. Isoautofluorescence denotes a uniform signal regarded as normal. Hypoautofluorescence indicates reduced signal intensity, which may result from the loss or depletion of fluorophores, masking by pigment or blood, or tissue loss. Hyperautofluorescence describes increased signal intensity caused by higher fluorophore concentrations, altered fluorophore composition, or structural changes with accumulation of (auto)fluorescent material.
This terminology forms the basis for pattern recognition and interpretation in daily practice for many conditions, particularly macular degeneration, inherited retinal conditions, inflammatory disease, and tumors.
Macular Degeneration
AMD illustrates the clinical relevance of FAF impressively (Figure 2). QAF analyses show that FAF is often reduced overall in AMD, reflecting RPE degeneration and cell loss.4,5 At the same time, a rim or patches of increased autofluorescence are often found at the edges of atrophic areas. Histological-imaging correlations have shown that this hyperautofluorescent signal is due to vertically superimposed or extruded RPE cells, migrating RPE cell populations, and accumulated cell material at the border between intact and atrophic retina.6 In the transition zone between non-atrophic and atrophic areas, a complex mosaic structure of hypo- and hyperautofluorescent areas emerges, reflecting basement membrane deposits, cell migration, and varying stages of RPE loss.6 In completely atrophic regions with complete RPE loss, the FAF signal is almost extinguished. In geographic atrophy (GA) due to AMD, atrophic area as determined by short-wavelength FAF is an accepted clinic endpoint in disease and therapy monitoring. FAF is recommended within a multimodal imaging approach for longitudinal assessment of GA progression.
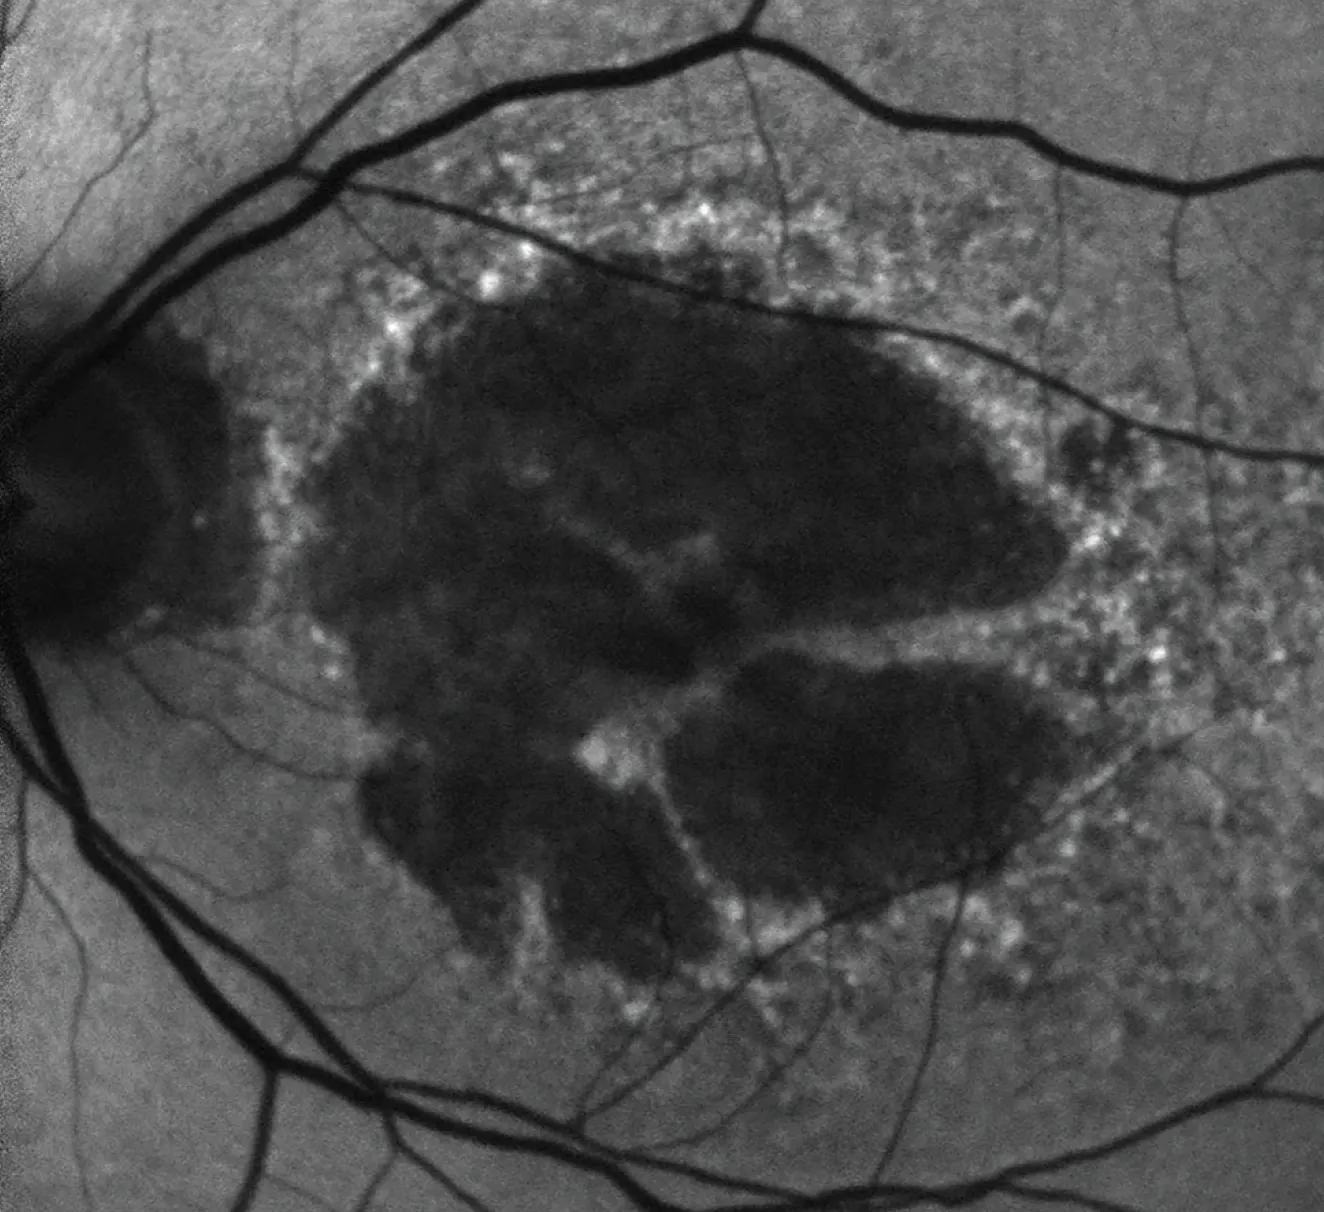
Figure 2. In the short-wavelength FAF of an eye with late-stage GA due to AMD, the area of GA appears hypoautofluorescent due to RPE cell loss. The transitional zone adjacent to the GA lesion is hyperautofluorescent and hypoautofluorescent. Hyperautofluorescence results from stacked RPE cells.
Rare Disease
FAF imaging is particularly useful for inherited retinal diseases, as it reflects dysfunction of the RPE and abnormal accumulation of autofluorescent material. FAF is an important part of multimodal imaging for the diagnosis and long-term monitoring in these conditions, as it helps characterize disease patterns and supports the differential diagnosis.
In Stargardt disease, FAF typically shows areas of increased autofluorescence caused by excess subretinal accumulation of bisretinoids, often with characteristic fleck-like lesions, alongside expanding regions of reduced autofluorescence that indicate progressive RPE atrophy.7
In Best vitelliform macular dystrophy, marked central hyperautofluorescence is seen in the vitelliform stage. As the disease progresses, FAF becomes heterogeneous, with mixed areas of increased and decreased signal, and advanced stages are characterized by pronounced hypoautofluorescence, indicating RPE loss.8
Pattern dystrophies display distinctive, often symmetrical patterns of increased autofluorescence related to abnormal autofluorescence material distribution within the RPE.
In retinitis pigmentosa, FAF commonly reveals a parafoveal ring of increased autofluorescence that constricts over time, highlighting the border between relatively preserved and degenerating retina, while peripheral hypoautofluorescence reflects widespread RPE degeneration.7
Choroideremia typically shows large, well-defined areas of reduced autofluorescence corresponding to chorioretinal atrophy, with residual islands of preserved signal in earlier stages.7
Other Retinal Conditions
FAF imaging is also useful for identifying drug-induced retinal toxicity. In hydroxychloroquine retinopathy, FAF commonly shows a parafoveal or pericentral ring of increased autofluorescence, indicating early stress of the RPE. With progression, central areas of reduced autofluorescence emerge, reflecting irreversible RPE damage. Notably, FAF changes can be detected before visible fundus abnormalities become apparent on clinical examination. FAF imaging should be performed early after initiating hydroxychloroquine to exclude pre-existing abnormalities and provide a reference for follow-up. During treatment, annual FAF is advised, although screening may be postponed within the first 5 years in the absence of major risk factors such as high dosage, prolonged use, renal impairment, or tamoxifen therapy.9 Interestingly, QAF studies in patients on hydroxychloroquine therapy revealed a general increased autofluorescent signal at the posterior pole, independent of pathological changes.10
FAF is also useful for evaluating the activity and distribution of inflammatory retinal diseases and is recommended both in the initial differential diagnostic assessment and for follow-up after diagnosis is established. In multiple evanescent white-dot syndrome, FAF shows multiple small hyperautofluorescent spots that often fade as the patient recovers. In acute zonal occult outer retinopathy, sharply defined areas of hypoautofluorescence correspond to outer retinal and RPE dysfunction. In multifocal choroiditis and serpiginous choroiditis, active lesions often have hyperautofluorescent borders, while older, inactive scars appear hypoautofluorescent due to permanent tissue loss.11
Tumors such as choroidal melanomas or other intraocular space-occupying lesions alter the FAF signal due to melanin content, the reactive RPE changes, and accompanying fluid or exudates, the latter often leading to hyperautofluorescence. In these situations, FAF helps to detect the extent and activity of lesions, assess disease progression, and document the effects of therapy.12
A TOOL THAT’S TRIED-AND-TRUE
FAF provides a window into the metabolic and structural status of the RPE-photoreceptor complex. Areas of increased or decreased autofluorescence reflect local changes in fluorophore levels, cell health, and overlying tissue, making FAF a valuable tool for monitoring disease activity and progression. Once primarily descriptive, FAF is now widely used for diagnosis, prognostic assessment, and guiding treatment strategies in diverse retinal diseases—with even better and more detailed analysis thanks to future autofluorescence techniques such as spectral analysis or fluorescence lifetime analysis.13
1. Schmitz-Valckenberg S, Pfau M, Fleckenstein M, et al. Fundus autofluorescence imaging. Prog Retin Eye Res. 2021;81:100893.
2. Bermond K, Wobbe C, Tarau IS, et al. Autofluorescent granules of the human retinal pigment epithelium: phenotypes, intracellular distribution, and age-related topography. Invest Ophthalmol Vis Sci. 2020;61(5):35.
3. Delori F, Greenberg JP, Woods RL, et al. Quantitative measurements of autofluorescence with the scanning laser ophthalmoscope. Invest Ophthalmol Vis Sci. 2011;52(13):9379-9390.
4. Gliem M, Müller PL, Finger RP, McGuinness MB, Holz FG, Charbel Issa P. Quantitative fundus autofluorescence in early and intermediate age-related macular degeneration. JAMA Ophthalmol. 2016;134(7):817-824.
5. Orellana-Rios J, Yokoyama S, Agee JM, et al. Quantitative fundus autofluorescence in non-neovascular age-related macular degeneration. Ophthalmic Surg Lasers Imaging Retina. 2018;49(10):S34-S42.
6. Curcio CA, Kar D, Owsley C, Sloan KR, Ach T. Age-related macular degeneration, a mathematically tractable disease. Invest Ophthalmol Vis Sci. 2024;65(3):4.
7. Oh JK, Moussa O, Lam BL, Sengillo JD. Fundus autofluorescence in inherited retinal disease: a review. Cells. 2025;14(14):1092.
8. Iovino C, Ramtohul P, Au A, Romero-Morales V, et al. Vitelliform maculopathy: Diverse etiologies originating from one common pathway. Surv Ophthalmol. 2023;68(3):361-379
9. Marmor MF, Ahn SJ, Ehlers JP, et al. Special AAO report: recommendations on screening for hydroxychloroquine retinopathy (2025 revision). Ophthalmology. 2026;133(4):439-450.
10. Yusuf IH, Issa PC, Ahn SJ. Novel imaging techniques for hydroxychloroquine retinopathy. Front Med (Lausanne). 2022;9:1026934.
11. Mauschitz MM, Zeller M, Pradeep Sagar P, et al. fundus autofluorescence in posterior and panuveitis-an under-estimated imaging technique: a review and case series. Biomolecules. 2024;14(5):515.
12. Verbeek S, Dalvin LA. Advances in multimodal imaging for diagnosis of pigmented ocular fundus lesions. Can J Ophthalmol. 2024;59(4):218-233.
13. Hammer M, Oertel J, Alderzy H, Tarhan M, Meller D, Curcio CA. Fundus autofluorescence intensity, lifetime, and spectral imaging in age-related macular degeneration. Exp Eye Res. 2025;258:110500.