KEY TAKEAWAYS
- In the clinic, the most granular assessment of retinal anatomy is derived from OCT, which has generated most modern imaging biomarker candidates.
- Promising dry AMD imaging biomarkers include drusenoid lesions, intraretinal hyperreflective foci, loss of outer retinal integrity, choriocapillaris perfusion and thickness, and pigmentary changes.
- Eventually, the integration of multivariable risk calculators may provide composite progression estimates for patients, clinicians, and researchers.
The modern parameters for dry AMD disease staging were first outlined by the Beckman classification in 2013.1 In 2017, the Classification of Atrophy Meeting provided an updated consensus on OCT-based classification of geographic atrophy (GA).2 Dry AMD disease staging relies on a combination of dilated fundus examination, color fundus photography (CFP), fundus autofluorescence (FAF), and OCT. Disease progression is gauged by these same modalities, with OCT being the most reliable for assessing interval anatomic changes. FAF is particularly well-suited for tracking GA lesion topography over time, with active expansion of GA lesion(s) on FAF representing the key indication for considering anticomplement therapy.
Other structural and functional testing modalities are also under investigation as adjuncts for assessing the progression of dry AMD. For example, there is burgeoning interest in using OCT angiography to evaluate regional flow features of the choriocapillaris in different stages of dry AMD.3 In addition, functional measurements can be used to quantify sub-anatomic AMD progression in patients, with studies validating functional metrics such as microperimetry, dark adaptation, contrast sensitivity, and low-luminance visual acuity.4,5
In clinic, the most granular assessment of retinal anatomy is derived from OCT, which has generated most modern imaging biomarker candidates. A variety of tomographic disease features have been reported, providing us with broad insight into the diversity of anatomic changes that can occur during the natural history of dry AMD. The ability to leverage these imaging biomarkers into risk stratification algorithms will improve our ability to counsel patients and direct clinical trial design.
While the dry AMD pipeline is overwhelmingly focused on curbing progression of established GA, it would be ideal to intervene prior to irreversible loss of retinal tissue. The confident prediction of areas of retina at high risk for progression to GA would facilitate testing therapeutic candidates for potential effect on the incidence of GA.
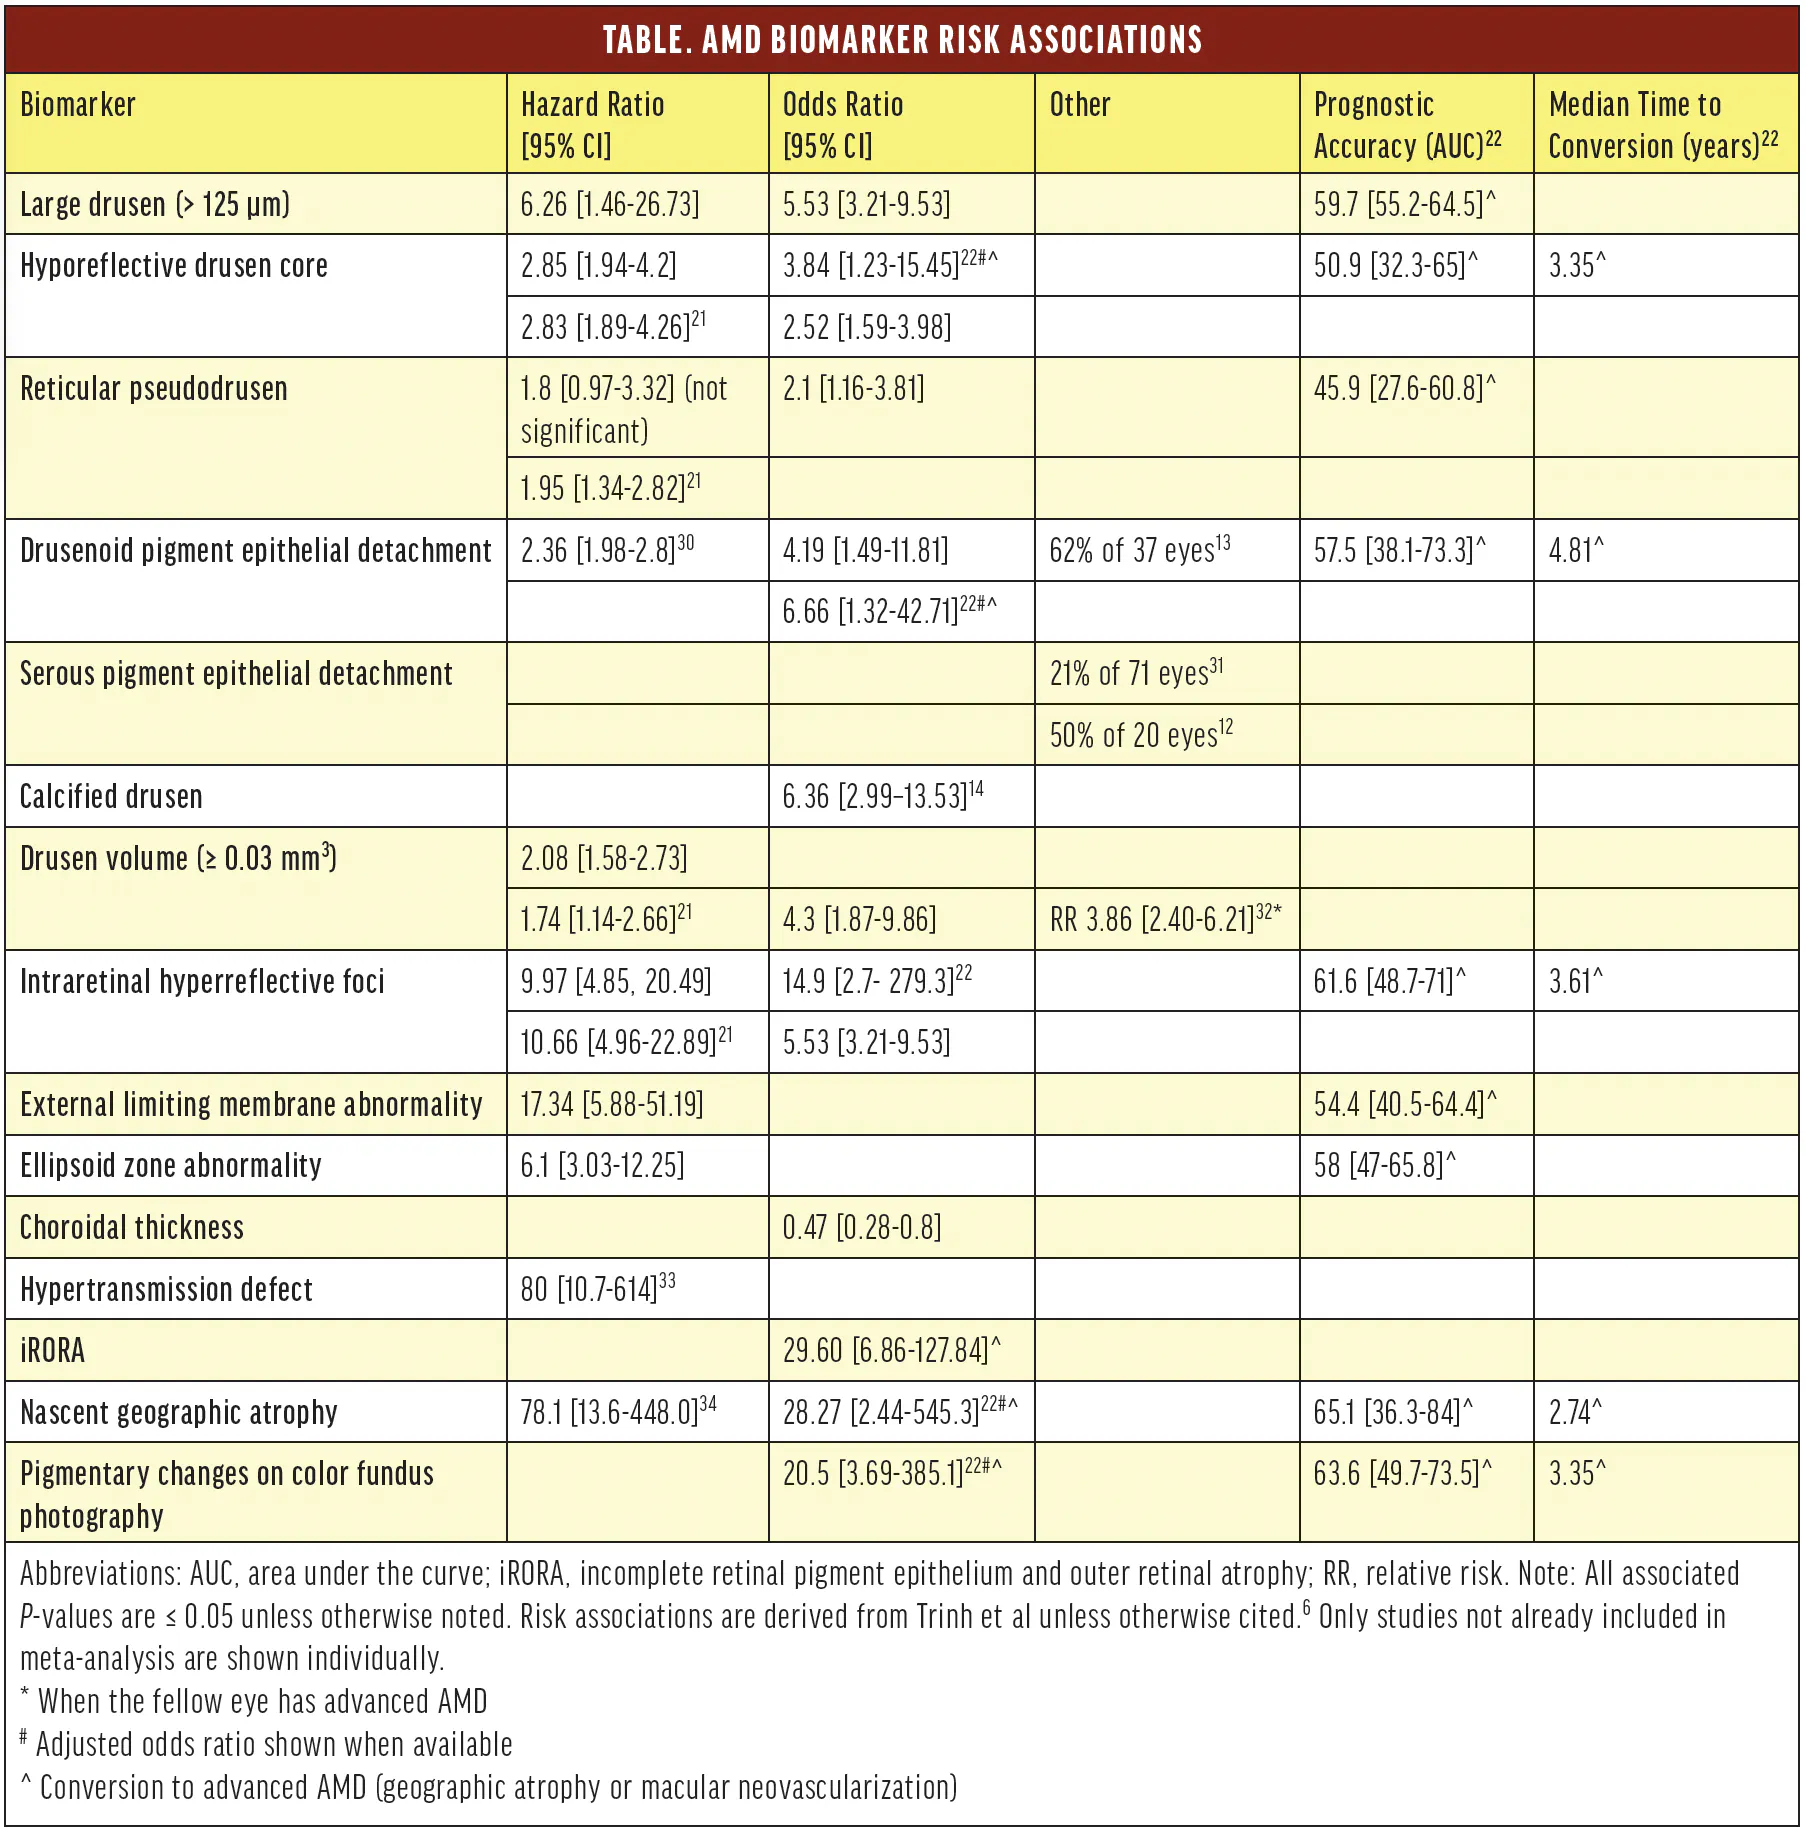
Here, we highlight a list of promising dry AMD imaging biomarkers and the associated risk of developing GA or advanced AMD (GA and/or macular neovascularization; Table). The predictive value of many of these markers has been evaluated by various groups over the years, including in a recent Cochrane-style meta-analysis by Trinh et al.6
DRUSENOID LESIONS
While the array of drusen and drusenoid lesion subtypes continues to grow,7-9 only a subset has been shown to confer significant risk for progression to advanced dry AMD (Figure). They range widely in size (small < 63 μm, medium ≥ 63-125 μm, and large > 125 μm), location, morphology, and reflectance pattern. Drusen with hyporeflective or hollow cores have been associated with reduced choriocapillaris flow on OCT angiography.10 Reticular pseudodrusen (RPD), or subretinal drusenoid deposits, are distinguishable by their subretinal location and typically have a distinctive reticular or “leopard spot” pattern on FAF.8 Drusenoid and serous pigment epithelium detachments (PEDs) can be quite large (hundreds of microns). Collapse of either lesion type is frequently followed by loss of outer retinal and retinal pigment epithelium (RPE) architecture, and for drusenoid PEDs, thinning of the underlying choroid.11-13 Calcified drusen demonstrate either hyporeflective or heterogeneous internal reflectivity on OCT and appear refractile on examination.14 Total drusen volume can be computed by automatic segmentation software. A greater than 0.03 mm3 drusen volume constitutes a high drusen burden but only has a weak risk association with GA. Drusen undergo dynamic formation and regression with undulating total drusen volumes.15 Progression to GA may be preceded by drusen regression, especially larger drusen.16,17 While the total drusen volume trend may be more informative than any single absolute value, consideration of individual drusen attributes remains vastly more predictive.
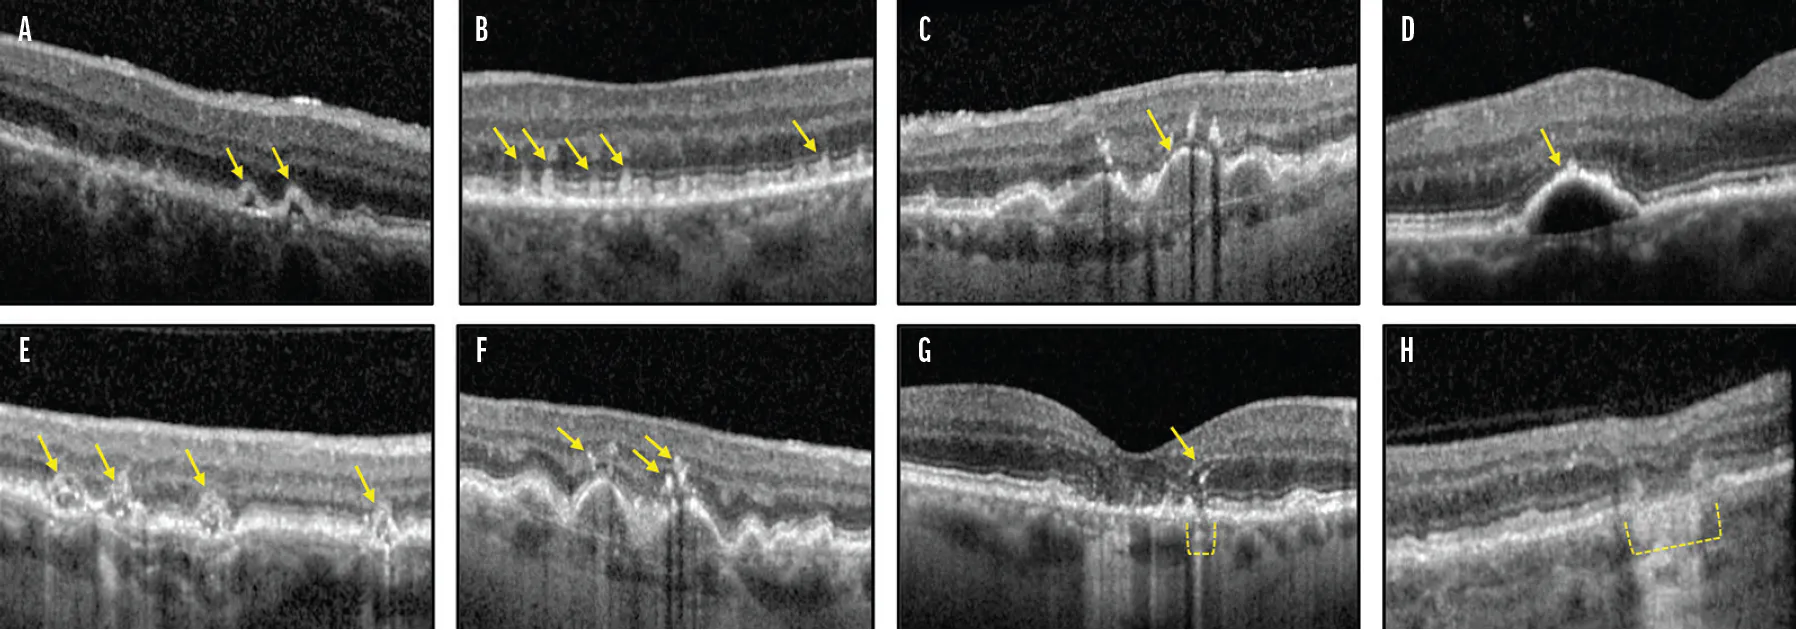
Figure. OCT biomarkers associated with the risk of progression to GA include drusen with hyporeflective cores (A), RPD (B), drusenoid PED (C), serous PED (D), calcified drusen (E), IRHF (F), nascent GA (G), and iRORA (H). The lesion of interest is indicated by a yellow arrow or dashed bracket. Of note, iRORA is also present in panel A, IRHFare present in panel C, and drusenoid PEDs are present in panel F.
INTRARETINAL HYPERREFLECTIVE FOCI (IRHF)
These foci are observed by OCT in the retina, often overlying drusen and drusenoid PEDs. They can be clustered or singular, and 87% are located below the junction between the outer plexiform layer and inner nuclear layer.18 IRHF have a 66% correlation with pigment clumping on CFP.18 These foci are hypothesized to be migrated RPE cells or infiltrating macrophages.19,20 IRHF carry a significant risk for progression to advanced AMD with a risk association ranging between 5 and 15 and an estimated time to late AMD of 3.35 to 3.61 years.6,21,22
LOSS OF OUTER RETINAL INTEGRITY
The Classification of Atrophy Meeting group outlined the criteria and terminology for staging structural retinal deterioration preceding GA as well as defining GA. These stages are termed incomplete RPE and outer retinal atrophy (iRORA) and complete RPE and outer retinal atrophy (cRORA).2 cRORA is defined by outer retinal and RPE loss with choroidal hypertransmission ≥ 250 μm in diameter. iRORA lesions include all three of these features but do not quite fulfill cRORA criteria.
A separate, somewhat intermediate imaging entity is nascent GA, which is defined by either subsidence of the outer plexiform layer and inner nuclear layer, or a hyporeflective wedge in Henle nerve fiber layer.16 It may be accompanied by RPE attenuation and choroidal hypertransmission and often overlaps with iRORA lesions.16 Objectively, iRORA and nascent GA lesions represent later stages of disease in which irreversible tissue loss has already occurred. Predictably, they are both highly associated with progression to GA. While this is useful for preparing patients for impending vision loss, these biomarkers are impractical for potential trials aiming to modify GA incidence. Imaging biomarkers that precede these substantive anatomic lesions would be more useful for any therapeutic attempts to forecast and modify GA incidence.
CHORIOCAPILLARIS PERFUSION AND THICKNESS
Focal thinning of the choriocapillaris has been associated with drusen, particularly drusen with hyporeflective cores. RPE loss correlates linearly with choriocapillaris loss, and focal flow impairments have been found in relation to drusen, as well as in areas of nascent GA.23-25 In a meta-analysis, total choroidal thickness was inversely correlated with risk for GA (odds ratio = 0.476).
PIGMENTARY CHANGES
In a follow-up study to their meta-analysis, Trinh et al evaluated the accuracy of biomarker risk associations to predict advanced AMD.22 The highest risk biomarkers from their prior analysis were compared with their prognostic accuracy against CFP in a real-world, longitudinal study. Surprisingly, pigmentary abnormalities on CFP had the most impressive profile in terms of prevalence and prognostic performance (area under the curve = 77.7% [68.1, 87.3]) and sensitivity (92%). Pigmentary changes were previously independently identified as a risk factor for the presence of nascent GA (odds ratio = 16.84 [2.42-117.24]),16 which is itself not distinguishable on examination or CFP. This study re-establishes that macular pigmentary changes should remain a reliable and highly predictive biomarker for progression to advanced dry AMD and may be especially useful in under-resourced clinics, remote screening programs, and AI algorithms.
IMPLEMENTING BIOMARKERS IN THE CLINIC
OCT is the cornerstone for dry AMD staging and risk stratification. Retina specialists should be aware of the range of possible structural changes in this heterogenous disease and their relative prognostic implication for progression to vision-threatening disease. Eventually, the integration of multivariable risk calculators may provide composite progression estimates for patients, clinicians, and researchers.
Progress toward this goal is underway, as our group and others have already developed deep-learning algorithms to predict progression to GA.26,27 Automated prediction systems are already in use, as AI-based software (eg, RetInSight, Topcon) was approved in Europe, Australia, and New Zealand, and under investigational use in the United States.28,29 Time will tell whether these systems will be integrated into the retina clinic, employed for patient screening, monitoring, and outcome quantitation in clinical research, or both.
1. Ferris FL, Wilkinson CP, Bird A, et al. Clinical classification of age-related macular degeneration. Ophthalmology. 2013;120(4):844-851.
2. Sadda SR, Guymer R, Holz FG, et al. Consensus definition for atrophy associated with age-related macular degeneration on OCT: classification of atrophy report 3. Ophthalmology. 2018;125(4):537-548.
3. Waheed NK, Moult EM, Fujimoto JG, Rosenfeld PJ. Optical coherence tomography angiography of dry age-related macular degeneration. Dev Ophthalmol. 2016;56:91-100.
4. Chandramohan A, Stinnett SS, Petrowski JT, et al. Visual function measures in early and intermediate age-related macular degeneration. Retina. 2016;36(5):1021-1031.
5. Lad EM, Fang V, Tessier M, et al. Longitudinal evaluation of visual function impairments in early and intermediate age-related macular degeneration patients. Ophthalmol Sci. 2022;2(3):100173.
6. Trinh M, Cheung R, Duong A, Nivison-Smith L, Ly A. OCT prognostic biomarkers for progression to late age-related macular degeneration: a systematic review and meta-analysis. Ophthalmol Retina. 2024;8(6):553-565.
7. Spaide RF. Disease Expression in nonexudative age-related macular degeneration varies with choroidal thickness. Retina. 2018;38(4):708-716.
8. Curcio CA, Messinger JD, Sloan KR, McGwin G, Medeiros NE, Spaide RF. Subretinal drusenoid deposits in non-neovascular age-related macular degeneration: morphology, prevalence, topography, and biogenesis model. Retina. 2013;33(2):265-276.
9. Zhang X, Sivaprasad S. Drusen and pachydrusen: the definition, pathogenesis, and clinical significance. Eye (Lond). 2021;35(1):121-133.
10. Byon I, Ji Y, Alagorie AR, Tiosano L, Sadda SR. topographic assessment of choriocapillaris flow deficits in the intermediate age-related macular degeneration eyes with hyporeflective cores inside drusen. Retina. 2021;41(2):393-401.
11. Karabulut S, Kaderli ST, Karalezli A. Long-term outcomes of drusenoid retinal pigment epithelium detachment in eyes with age-related macular degeneration. Indian J Ophthalmol. 2025;73(6):843-846.
12. Goudot MM, Souied EH, Colantuono D, et al. Natural history of non-neovascular pigment epithelial detachments (PEDs): Comparison between serous and drusenoid PEDs. AJO International. AJO International. 2025;2(9):100100.
13. Dolz-Marco R, Balaratnasingam C, Gattoussi S, Ahn S, Yannuzzi LA, Freund KB. Long-term choroidal thickness changes in eyes with drusenoid pigment epithelium detachment. Am J Ophthalmol. 2018;191:23-33.
14. Tan ACS, Pilgrim MG, Fearn S, et al. Calcified nodules in retinal drusen are associated with disease progression in age-related macular degeneration. Sci Transl Med. 2018;10(466):eaat4544.
15. Yehoshua Z, Wang F, Rosenfeld PJ, Penha FM, Feuer WJ, Gregori G. Natural history of drusen morphology in age-related macular degeneration using spectral domain optical coherence tomography. Ophthalmology. 2011;118(12):2434-241.
16. Wu Z, Luu CD, Ayton LN, et al. Optical coherence tomography-defined changes preceding the development of drusen-associated atrophy in age-related macular degeneration. Ophthalmology. 2014;121(12):2415-2422.
17. Brader HS, Ying GS, Martin ER, Maguire MG; Complications of Age-Related Macular Degeneration Prevention Trial (CAPT) Research Group. Characteristics of incident geographic atrophy in the complications of age-related macular degeneration prevention trial. Ophthalmology. 2013;120(9):1871-1879.
18. Oncel D, Corradetti G, He Y, et al. Assessment of intraretinal hyperreflective foci using multimodal imaging in eyes with age-related macular degeneration. Acta Ophthalmol. 2024;102(1):e126-e132.
19. Lad EM, Cousins SW, Van Arnam JS, Proia AD. Abundance of infiltrating CD163+ cells in the retina of postmortem eyes with dry and neovascular age-related macular degeneration. Graefes Arch Clin Exp Ophthalmol. 2015;253(11):1941-1945.
20. Miura M, Makita S, Sugiyama S, et al. Evaluation of intraretinal migration of retinal pigment epithelial cells in age-related macular degeneration using polarimetric imaging. Sci Rep. 2017;7(1):3150.
21. Nassisi M, Lei J, Abdelfattah NS, et al. OCT risk factors for development of late age-related macular degeneration in the fellow eyes of patients enrolled in the HARBOR study. Ophthalmology. 2019;126(12):1667-1674.
22. Trinh M, Cheung R, Nam J, Ng D, Nivison-Smith L, Ly A. High risk does not guarantee high accuracy—Evaluating the prognostic accuracy of OCT biomarkers for predicting late AMD. Ophthalmic Physiol Opt. 2025;45(6):1293-1301.
23. McLeod DS, Grebe R, Bhutto I, Merges C, Baba T, Lutty GA. Relationship between RPE and choriocapillaris in age-related macular degeneration. Invest Ophthalmol Vis Sci. 2009;50(10):4982-4991.
24. Camino A, Guo Y, You Q, et al. Detecting and measuring areas of choriocapillaris low perfusion in intermediate, non-neovascular age-related macular degeneration. Neurophotonics. 2019;6(4):041108.
25. Moult EM, Waheed NK, Novais EA, et al. Swept-source optical coherence tomography angiography reveals choriocapillaris alterations in eyes with nascent geographic atrophy and drusen-associated geographic atrophy. Retina. 2016;36 Suppl 1(Suppl 1):S2-S11.
26. Dow ER, Jeong HK, Katz EA, et al. A deep-learning algorithm to predict short-term progression to geographic atrophy on spectral-domain optical coherence tomography. JAMA Ophthalmol. 2023;141(11):1052-1061.
27. Yan Q, Weeks DE, Xin H, et al. Deep-learning-based prediction of late age-related macular degeneration progression. Nat Mach Intell. 2020;2(2):141-150.
28. Regulatory approvals for AI-powered retinal disease monitoring. Topcon Healthcare. August 19, 2025. Accessed April 15, 2026. topconhealthcare.com/article/regulatory-approvals-for-ai-powered-retinal-disease-monitoring
29. Topcon Healthcare, Inc. acquires RetInSight GmbH to accelerate its AI-powered imaging innovation in eye care [press release]. May 2, 2025. Accessed April 15, 2026. topconhealthcare.com/article/topcon-healthcare-inc-acquires-retinsight-gmbh-to-accelerate-its-ai-powered-imaging-innovation-in-eye-care
30. Yu JJ, Agrón E, Clemons TE, et al. Natural history of drusenoid pigment epithelial detachment associated with age-related macular degeneration: age-related eye disease study 2 report no. 17. Ophthalmology. 2019;126(2):261-273.
31. Rouvas A, Datseris I, Malvina-Efthymia T, Kardara M, Theodossiadis P, Gouliopoulos N. Long-term natural course of avascular serous pigment epithelial detachment in age-related macular degeneration. Retina. 2025;45(10):1854-1861.
32. Abdelfattah NS, Zhang H, Boyer DS, et al. Drusen volume as a predictor of disease progression in patients with late age-related macular degeneration in the fellow eye. Invest Ophthalmol Vis Sci. 2016;57(4):1839-1846.
33. Laiginhas R, Shi Y, Shen M, et al. Persistent hypertransmission defects detected on en face swept source optical computed tomography images predict the formation of geographic atrophy in age-related macular degeneration. Am J Ophthalmol. 2022;237:58-70.
34. Wu Z, Luu CD, Hodgson LAB, et al. Prospective longitudinal evaluation of nascent geographic atrophy in age-related macular degeneration. Ophthalmol Retina. 2020;4(6):568-575.